Home automation is coming into the mainstream a with recent offerings from the big tech companies, and I'm interested in it too. I've had a number of home automation controllers, most recently an H3 Pro SEL from HomeSeer.
I've also become quite interested recently in DevOps monitoring, using InfluxDB, and Grafana. Sensu, Telegraf and Prometheus are great too, but not for this project.
So, I decided to import home status information into InfluxDB and graph it. The first step was getting the information from HomeSeer. There is a JSON-over-HTTP API, but no existing Java client. So, a simple HomeSeer H3 API client in Java was written: hsclient.
The next step was getting the data into influx. The best way to do this would be to write a Telegraf plugin. However, I wanted a chance to learn a little more about Java closures and lambas, so I wrote hsinflux a threaded command-line app which connects to HomeSeer on a schedule, downloads the device status data and drops it into InfluxDB. hsinflux is here.
The net result, with Grafana, is the ability to see my house temperatures, humidity, door and window status, and thermostats. Here are some examples.
House temperatures this week on 5 minute intervals
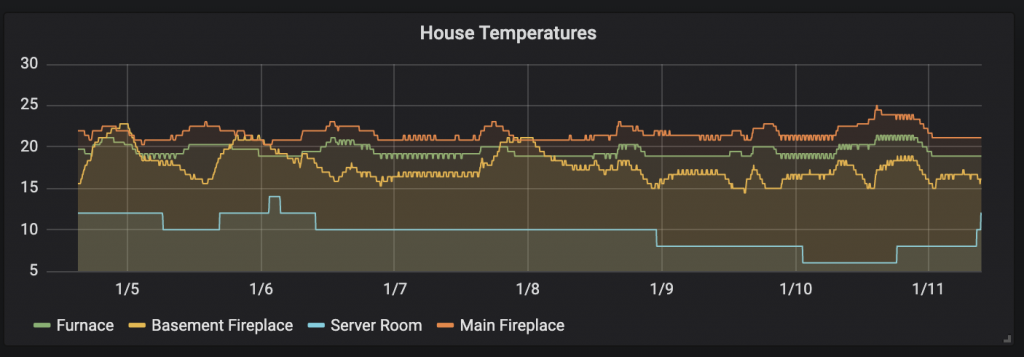
At the time of writing, its -17C outside, and my server room temperature is showing a steady decrease, down to -6C. The increase on the far right is the result of opening the server room door to get some warm air from the house.
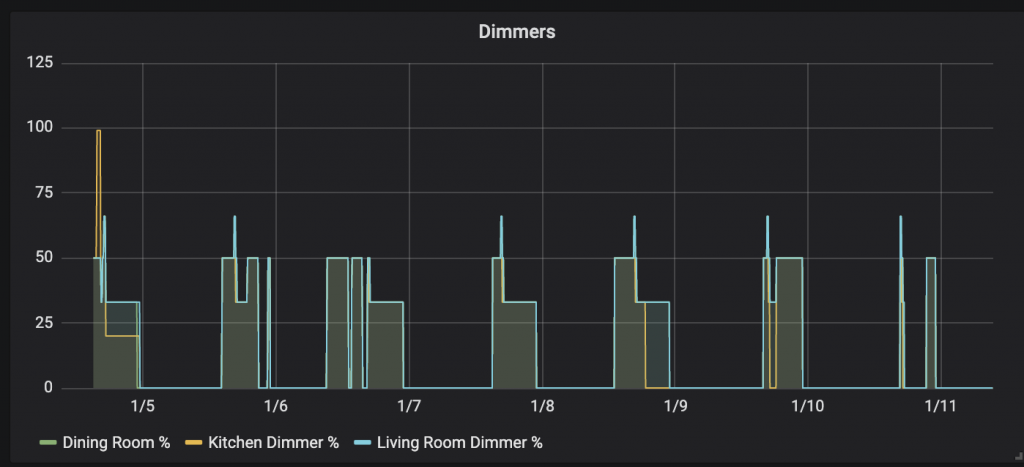
Dimmer Status
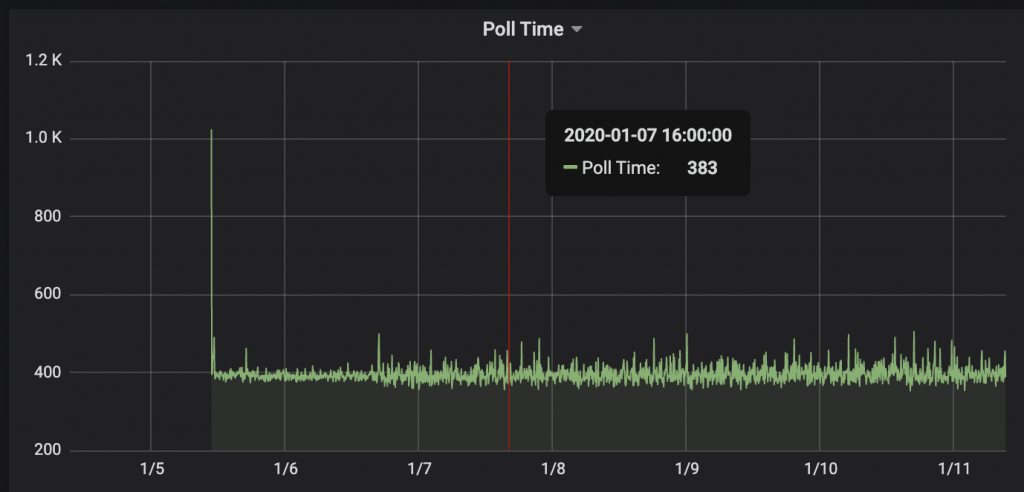
And since I have a TSDB, why not record the time it's taking to collect data from HomeSeer?
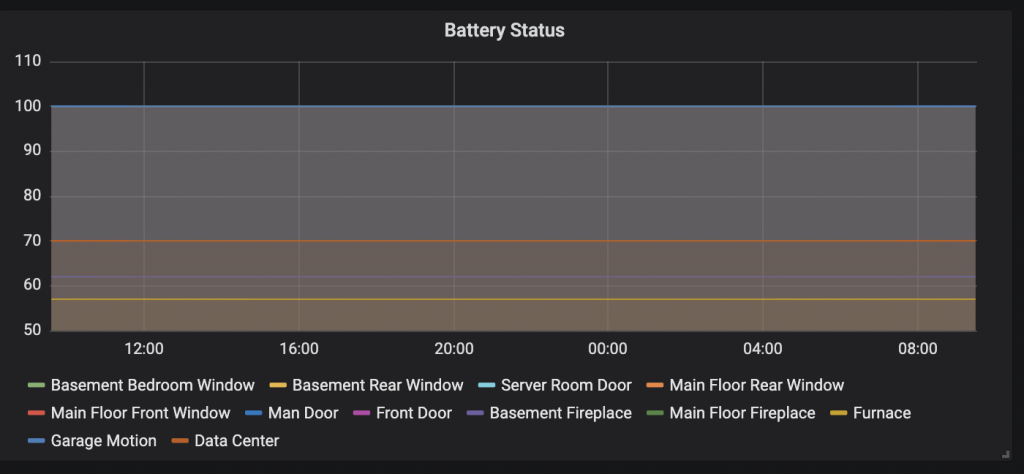
Since I can, I'm also querying battery charge on the devices that have batteries. It's not an interesting graph, but down the road I can use Grafana to alert me when the batteries need to be changed.
Overall, a great opportunity to become familiar with the technologies. Once the data is in Influx, building arbitrary graphs to visualize data is both simple and powerful. The graphs I've built are simple, however for IT professionals wanting insight into complex infrastructure, tools such as Influx and Grafana represent a step change in visibility and analysis.
From an operational perspective, TSDB's give DevOps engineers an opportunity to answer a question we've been trying to answer for decades:
What changed the hour before it crashed? The week before it crashed? The month before it crashed?